India Market Intelligence
Granular insights, Cross-validated with official records, updated monthly
450,000+
vehicles/month
All States
State-wise analysis
Fuel Type
ICE, CNG, Hybrid, Electric
Top Brands
Maruti, Hyundai, Tata, Mahindra
Comprehensive Data Fields
- Granular Make & Model: Precise breakdown by Brand and Model (unlike generic OEM-level public data).
- Standardized Segmentation: Clean classification of Body Styles (SUV, Sedan, etc.) and Market Segments (Subcompact, Compact, Midsize, etc.).
- Advanced Fuel Analysis: Detailed split of Petrol, Diesel, CNG, Hybrid, and BEV registrations.
- Pan-India State Coverage: Monthly registration volume tracking across all 36 States & Union Territories.
Strategic Powertrain & Regional Planning
Navigate the complexity of Bharat. Leverage state-wise monthly data—from Fuel Type dynamics to GVW-based commercial trends—to optimize your portfolio across 36 States & UTs.
- Fuel Type: Petrol, Diesel, CNG, Electric, Hybrid
- Granularity: Model-wise Fuel Split
- Specs: GVW (Gross Vehicle Weight), Type of Truck
- Classification: Make, Body Style
- Geo-Level: 36 States & Union Territories
- Metric: Monthly Registration Volume
The Proliance Advantage
| Features | Public Dashboard (e.g., Vahan / RTO Data) | Proliance Registration Data ⭐ (The Best Way) |
|---|---|---|
| Data Granularity | Manufacturer / OEM Level Only | ✓ Deep Make & Model Level: Granular breakdown for precise market share analysis (not just brand totals). |
| Data Quality |
Raw, Mixed Types & Unverified (Often mixes Agri/Tractors with Cars) |
✓ Cleaned & Categorized: Pure Passenger Vehicle (LV) & MHCV data only. We filter out agricultural & construction noise. |
| Usability | Hard to analyze / Requires cleanup | ✓ Ready-to-Use (Standardized): Normalized fields ready for immediate BI integration. No manual cleaning needed. |
| Geography | RTO / State (Messy Mapping) | ✓ Structured State-Level: Consistent and accurate mapping across all 36 States & Union Territories. |
True Market Share Visibility
See actual passenger vehicle performance across 36 States & UTs, stripped of agricultural noise.
RTO-Level Targeting
Identify high-potential territories by drilling down from State level to specific RTOs for precise dealer network planning.
Powertrain Shift Tracking
Monitor the rapid migration from Diesel to CNG, Hybrid, and EV in specific regions to align inventory with local demand.
Granular Model Benchmarking
Move beyond OEM totals. Compare specific models (e.g., Creta vs. Seltos) to validate segment positioning and launch targets.
Why Choose Us
100% Model Visibility
Covers all model, including Luxury & New EV brands often missing from standard dashboards.
Pre-Cleaned Data
No agricultural or commercial noise. Pure passenger vehicle data, standardized and ready for analysis.
Standardized Taxonomy
Unified naming conventions for easy comparison across states and time periods.
Ongoing Quality Audits
Multi-stage validation process that cross-references historical trends to flag and correct statistical anomalies, ensuring data integrity for confident decision-making.
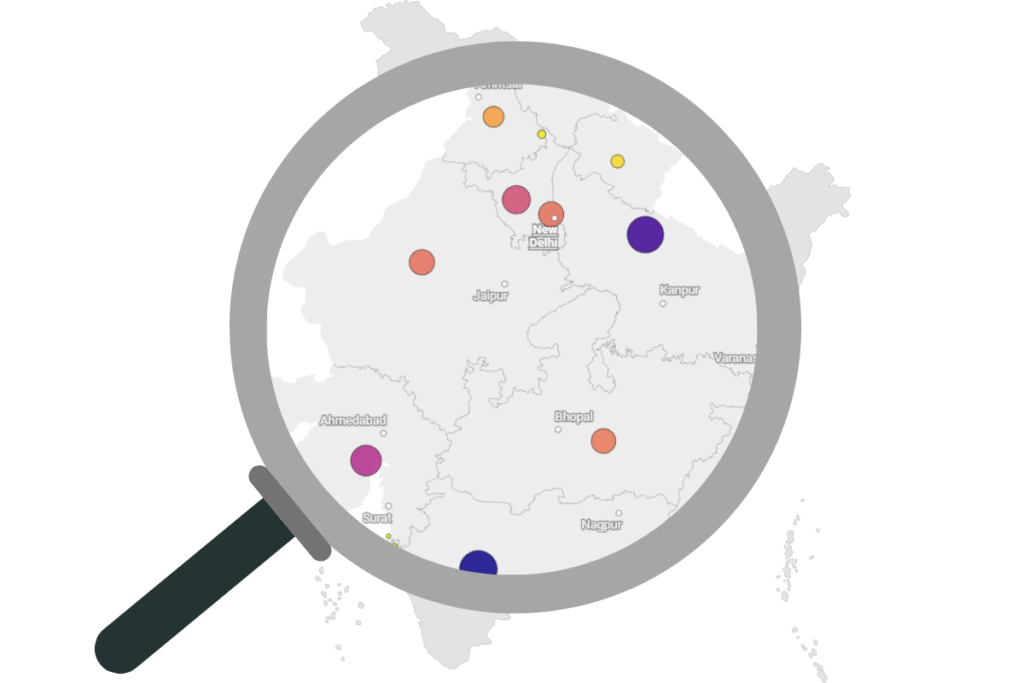
Fuel Type Preferences Across Indian States
Different parts of India favour different fuel types. By analysing registration shares by state and fuel type, you can plan production, allocation, and marketing with a mix that actually reflects real-world demand patterns in the region.
-
Regional Powertrain Divide:
Identify high-opportunity fuel markets instantly. CNG dominates metros and industrial hubs (23-34% in Maharashtra, Gujarat, Delhi), petrol leads traditional and northeastern states (70%+ penetration), diesel concentrates in commercial corridors (30-45% in logistics-heavy regions). Spot which fuel variant to prioritize by state instead of guessing from national averages that mask 40+ percentage-point regional gaps.
-
EV & Hybrid Hotspots:
Pinpoint exactly which states are leading the electrification charge—allowing you to target EV inventory where adoption is real, not just hyped. Chandigarh (6.58% BEV) and Delhi (6.00%) are India's genuine EV markets. Petrol hybrid adoption concentrates in metros and tech hubs (Chandigarh 14.74%, Telangana 13.95%, Goa 12.89%), while 25+ states show <1% BEV, requiring conventional strategies.
-
Tailored Launch Strategies:
Stop guessing allocation. Use regional fuel type preferences to ship the right variant mix—concentrating CNG in 8 dominant metros, petrol in petrol-dominant northeast/rural regions, diesel in logistics corridors, and EVs only in genuinely receptive metros (Delhi, Chandigarh, Kerala). Avoid EV overstock in petrol-dominant states (70-75%) where infrastructure remains inadequate.
State-Level Concentration: Where India's Powertrain Demand Clusters
India’s vehicle registrations exhibit significant geographic concentration across high-performing states. With state-level registration data, you can instantly identify where the automotive market is most active and where emerging secondary opportunities are beginning to flourish.
-
Identify Your True Revenue Centers:
Concentrate your inventory and sales efforts on high-volume states like Maharashtra, Uttar Pradesh, and Gujarat, where vehicle registrations cluster and market penetration is deepest. These states represent the core battleground where maximizing market share is critical.
-
Uncover Hidden Growth Corridors:
Look beyond the traditional powerhouses—identify emerging secondary cities and states where registration volumes are rising but competitor networks remain fragmented. States like Karnataka, Tamil Nadu, and Haryana present untapped opportunities for expansion before the market matures.
-
Align Your Dealer Network with Registration Hotspots:
Overlay your current dealership locations against actual registration data to expose gaps in your coverage. This reveals where you're underrepresented relative to market potential and where rivals may already be establishing footholds.
Latest Industry Intelligence
Expert analysis and trends in India automotive market
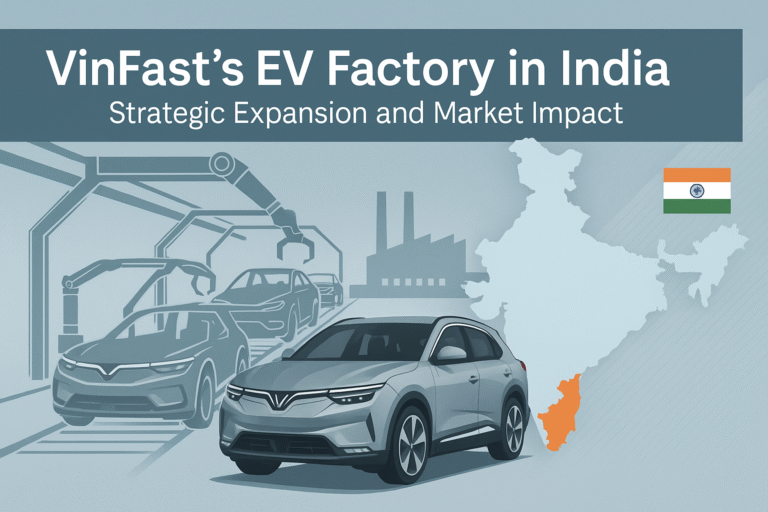
VinFast’s India Factory: EV Market Impact and Regional Strategy
In a pivotal move to expand its global footprint, VinFast—Vietnam’s leading electric vehicle (EV) manufacturer—has...

Kia Plans 250,000-Unit EV Production Facility in Thailand
Overview Kia Corporation, South Korea’s second-largest automaker and a subsidiary of Hyundai Motor Group, is...

BMW Launches New 5 Series and MINI Electric Models in India
BMW is set to make a significant splash in the Indian luxury car market with...
Frequently Asked Questions
Yes, our datasets are fully segmented by vehicle type, including passenger cars, pickups, SUVs, commercial trucks, electric vehicles, and more. Custom segmentation is available to match your exact analysis needs.
Monthly datasets are delivered within the following month, typically around 30 days after month-end. Quarterly datasets are provided within 45 days after the quarter closes, ensuring comprehensive processing and validation before delivery.
Yes, our state-wise breakdown enables detailed market comparison. Identify high-growth states, benchmark regional performance, and develop targeted expansion strategies.
Our data is meticulously sourced from trusted government agencies and verified third-party providers. Each dataset undergoes multi-level validation including automated error detection, expert review, and routine audits to ensure accuracy and consistency across all records.
Still have questions? Contact Us
FREE SAMPLE DATASET
Evaluate Our Data Granularity & Standards
Experience the depth of Proliance’s automotive intelligence. Download our sample file to review comprehensive column headers, data formatting, and the localized vehicle classification standards we use for the Thai market. Ensure our data aligns with your analytical requirements before you commit.
- Actual Data Columns: See all available fields (Make, Model, Body Style).
- Excel Format (.xlsx): Flat-file database structure, ready for Pivot Tables.
- Granularity Check: Evaluate the level of detail included.
Fill out the form below, and our team will email the sample file to you shortly.
Stop Guessing with Sales Reports. Start Strategizing with On-Road Reality.
Join top OEMs and consultancies who leverage our granular, verified registration data for mission-critical decisions.