Standardized Vehicle Registration Data for ASEAN & GCC
Get tailored Excel datasets with a unified format across all countries. From granular Geolocation insights to National-level technical specs—cleaned and ready for your immediate analysis.
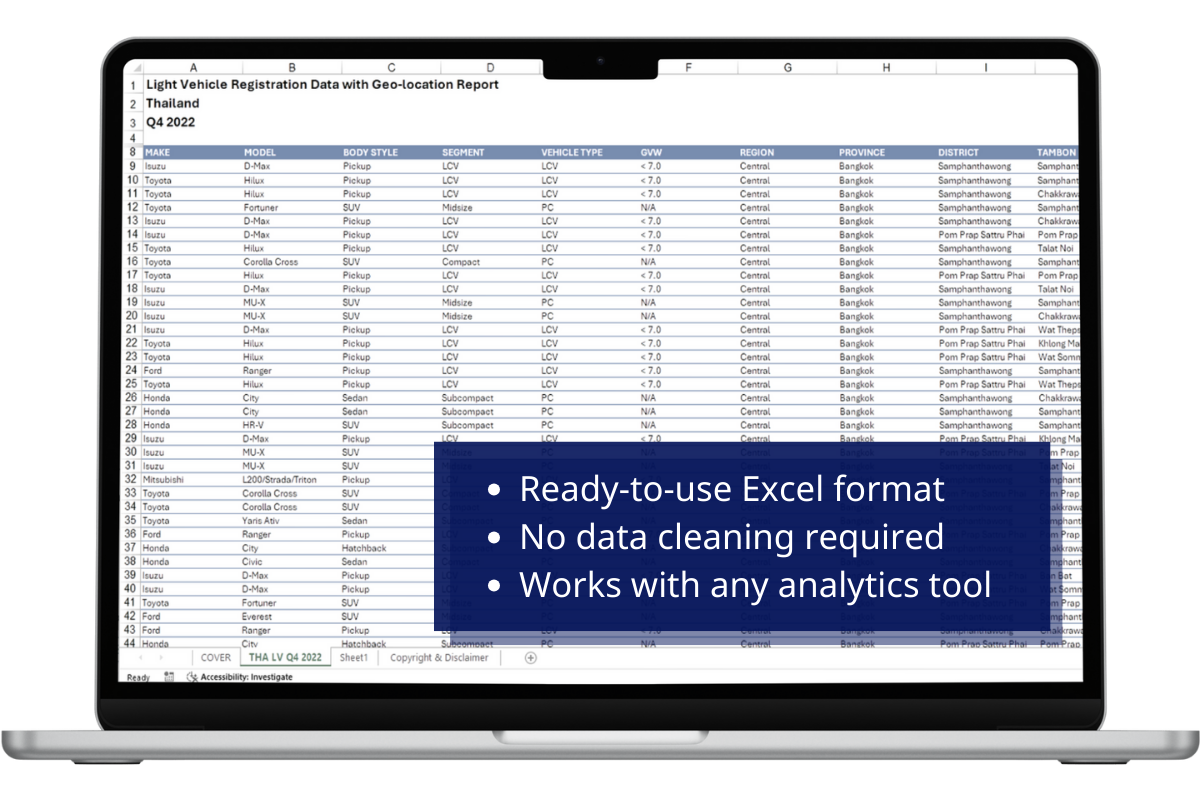
Optimized for Immediate Analysis
Clean, standardized Excel files designed to integrate seamlessly with your existing tools and workflows.
Universal Compatibility
Seamless Integration. Structured specifically for direct import into Power BI, Tableau, Python, R, or SAP. No complex mapping or proprietary software needed.
Data Ownership & Control
No Vendor Lock-in. Once delivered, the data is yours forever. Store it on your local servers or private cloud without recurring subscription fees for access.
Analyst-Ready Format
Zero Cleaning Required. Skip the messy data preparation. Our files arrive with standardized column headers and validated values, ready for Pivot Tables instantly.
Flexible Granularity
Deep-Dive Capabilities. Easily filter by province, district, vehicle segment, or fuel type using standard Excel functions to uncover niche market insights.
Comprehensive Data Attributes
Our standardized datasets cover over 30+ key attributes, allowing for multidimensional analysis from macro trends to micro-market granularities.
- Make / Brand
- Model Name
- Body Type (SUV, Pickup, Sedan)
- Segment Classification
- Fuel Type (ICE, BEV, HEV, PHEV)*
- Engine Capacity (cc) / GVW*
*Available in select markets
- Country Level
- Region / State
- Province
- District (Amphur)*
- Sub-district (Tambon)*
- Postal Code*
*Granularity depends on specific market availability
- New Vehicle Registrations
- Vehicle Sales Data*
- Import & Export Volumes*
- PARC / Vehicles-in-Use (VIU)*
*Available in select markets only
Unlock Deeper Market Insights
Go beyond basic volume tracking. Our data structure supports advanced analytics for strategic decision-making.
EV Market Intelligence
Track the shift from ICE to Electric (BEV, PHEV, HEV) with precision. Monitor adoption rates by brand and region to identify emerging EV hotspots before competitors do.
Geolocation Analytics
Drill down from National level to Province, District, and Sub-district. Optimize dealer networks and territory planning based on actual registration density, not just population.
Competitive Benchmarking
Analyze competitor performance month-over-month. Track brand switching, segment dominance, and new model launch impacts with verified, government-sourced data.
Proven Business Impact
See how leading OEMs transform verified data into measurable success.
The Situation
A major automotive brand planning dealer expansion in Thailand relied on broad regional sales reports, missing critical local nuances.
The Challenge
Without granular visibility, they risked investing in saturated cities while ignoring high-potential districts (Amphurs) where competitors were quietly dominating.
Our Solution
We delivered monthly registration data down to the District level, allowing their analysts to map true demand versus registered owner addresses.
The Magic Moment
The data revealed 8 "hidden gem" districts with high pickup truck registration growth but no official dealership. The client moved quickly to capture these zones.
The Situation
An emerging EV manufacturer entering the Saudi Arabian market struggled to allocate inventory across Riyadh, Jeddah, and Dammam.
The Challenge
Shipping based on population density alone led to stock shortages in high-adoption zones and oversupply in slower markets.
Our Solution
We provided structured Quarterly Registration Data broken down by body type and fuel trend, fully formatted for their internal BI tools.
The Magic Moment
Analysis showed a rapid spike in EV registrations in specific affluent suburbs. The client realigned inventory to match this actual on-road demand, boosting turnover speed by 40%.
The Situation
An automotive brand was preparing to launch a new Compact SUV in Vietnam and the Philippines but faced uncertainty about the segment’s actual growth outside major capitals.
The Challenge
Relying on general industry reports gave them only “Total Market” numbers, obscuring the specific shift from Sedans to SUVs in provincial areas.
Our Solution
We provided 5 years of historical registration data classified by ‘Body Type’ and ‘Segment’, allowing them to model demand trends with district-level granularity.
The Magic Moment
The data proved that Tier-2 cities were driving 60% of the SUV segment's growth. The client shifted their launch marketing budget to these specific provinces, exceeding sales targets by 15%.
Stop Guessing with Sales Reports. Start Strategizing with On-Road Reality.
Join top OEMs and consultancies who leverage our granular, verified registration data for mission-critical decisions.